Electron microscopy

Description

VAST (Volume Annotation and Segmentation Tool) is a utility application for manual annotation of large EM stacks.

General labeling tool, used for a large variety of 3D data sets; electron-microscopic, multi-channel light-microscopic, and Micro-CT data sets as well as videos, and annotating arbitrary structures, regions and locations, depending on the user’s needs.

Description

Dragonfly is a software platform for the intuitive inspection of multi-scale multi-modality image data. Its user-friendly experience translates into powerful quantitative findings with high-impact visuals, driven by nuanced easy-to-learn controls.

For segmentation: It provides an engine fior machine Learning, Watershed and superpixel methods, support histological data .

It offers a 3D viewer, and python scripting capacities .

It is free for reserach use, but not for commercial usage.

DragonFly
Description

Web based viewer developped for google for very big data: 

Neuroglancer is a WebGL-based viewer for volumetric data. It is capable of displaying arbitrary (non axis-aligned) cross-sectional views of volumetric data, as well as 3-D meshes and line-segment based models (skeletons). The segmentation has to be done before loading the dataset, it is not done Inside the viewer.

This is not an official Google product.

It has among other the nice feature of beeing able to generate url for sharing a specific view.

Note that the only supported browser for now are 

  • Chrome >= 51
  • Firefox >= 46


Neuroglancer
Description

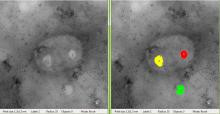
TEM ExosomeAnalyzer is a program for automatic and semi-automatic detection of extracellular vesicles (EVs), such as exosomes, or similar objects in 2D images from transmission electron microscopy (TEM). The program detects the EVs, finds their boundaries, and reports information about their size and shape.

The software has been developed in terms of project MUNI/M/1050/2013 and supported by Grant Agency of Masaryk University.

The EVs are detected based on the shape and edge contrast criteria. The exact shapes of the EVs are then segmented using a watershed-based approach.

With proper parameter settings, even images with EVs both lighter and darked than the background, or containing artifacts or precipitated stain can be processed. If the fully-automatic processing fails to produce the correct results, the program can be used semi-automatically, letting the user adjust the detection seeds during the intermediate steps, or even draw the whole segmentation manually.

screen capture from exosomeAnalyzer
Description

Paintera is a general visualization tool for 3D volumetric data and proof-reading in segmentation/reconstruction with a primary focus on neuron reconstruction from electron micrographs in connectomics. It features/supports:

  •  Views of orthogonal 2D cross-sections of the data at arbitrary angles and zoom levels
  •  Mipmaps for efficient display of arbitrarily large data at arbitrary scale levels
  •  Label data
    •  Painting
    •  Manual agglomeration
    •  3D visualization as polygon meshes
      •  Meshes for each mipmap level
      •  Mesh generation on-the-fly via marching cubes to incorporate painted labels and agglomerations in 3D visualization. Marching Cubes is parallelized over small blocks. Only relevant blocks are considered (huge speed-up for sparse label data).

Paintera is implemented in Java and makes extensive use of the UI framework JavaFX

Paintera screenshot