ImageJ Macros

Customizing ImageJ

These slides give an introduction to user interfacre customization in ImageJ using ImageJ Macro and to ImageJ Macro Markdown.

Big thanks to Jerome Mutterer (IBMP) and Nicolas De Francesco (IMBICE) who shared material openly I reused when making these slides.

Supplementary material is available as well under this doi: 10.5281/zenodo.4561714

Description

The tool exports rectangular regions, defined with the NDP.view 2 software (hammatsu) from the highest resolution version of the ndpi-images and saves them as tif-files.

Click the button and select the input folder. The input folder must contain pairs of ndpi and ndpa files. The regions will be exported to a subfolder of the input folder names zones.

has topic
has function
imagej toolset to export regions from ndpi and ndpa-files
Description

The tool allows to measure the area of the invading spheroïd in a 3D cell invasion assay. It can also count and measure the area of the nuclei within the spheroïd.

need a thumbnail
Description

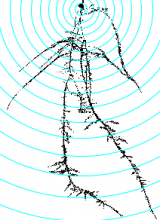
This tool allows to analyze morphological characteristics of complex roots. While for young roots the root system architecture can be analyzed automatically, this is often not possible for more developed roots. The tool is inspired by the Sholl analysis used in neuronal studies. The tool creates a binary mask and the Euclidean Distance Transform from the input image. It then allows to draw concentric circles around a base point and to extract measures on or within the circles. Instead of circles, which present the distance from the base point, horizontal lines can be used, which present the distance in the soil from the base-line. The following features are currently implemented:

  • The area of the root per distance/depth.
  • The number of border pixel per distance/depth, giving an idea of the surface in contact with the soil.
  • The maximum radius per distance/depth of a root, measured at the crossing points with the circles or lines.
  • The number of crossings of roots with the circles or lines.
  • The maximum distance to the left and the right from the vertical axis at crossing points with the circles or lines.
Concentric circles on the mask of a root, created by the Analyze Complex Roots Tool
Description

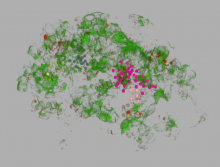
Analyze the clustering behavior of nuclei in 3D images. The centers of the nuclei are detected. The nuclei are filtered by the presence of a signal in a different channel. The clustering is done with the density based algorithm DBSCAN. The nearest neighbor distances between all nuclei and those outside and inside of the clusters are calculated.

has function