web

Description

FPBioimage is a volumetric visualization tool which runs in all modern web browsers. Try the tool yourself at our example site here.

has function
Description

The Image Data Explorer is a Shiny app that allows the interactive visualization of images and ROIs associated with data points shown in a scatter plot. It is useful for exploring the relationships between images/ROIs and associated data represented in tabular format. Additional functionalities include data annotation, dimensionality reduction and classification and feature selection.

has function
Description

Code to segment yeast cells using a pre-trained mask-rcnn model. We've tested this with yeast cells imaged in fluorescent images and brightfield images, and gotten good results with both modalities. This code implements an user-friendly script that hides all of the messy implementation details and parameters. Simply put all of your images to be segmented into the same directory, and then plug and go.

has function
Description

ImJoy is a plugin powered hybrid computing platform for deploying deep learning applications such as advanced image analysis tools.

ImJoy runs on mobile and desktop environment cross different operating systems, plugins can run in the browser, localhost, remote and cloud servers.

With ImJoy, delivering Deep Learning tools to the end users is simple and easy thanks to its flexible plugin system and sharable plugin URL. Developer can easily add rich and interactive web interfaces to existing Python code.

has topic
Description

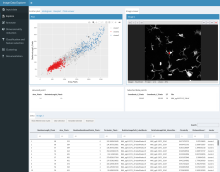
shinyHTM is an open source, web-based tool for data exploration, image visualization and normalization of High Throughput Microscopy data. Within shinyHTM the user is guided through a linear workflow which follows the following best practices:

  • Inspect the numerical data through plotting
  • Measurements are linked to raw images
  • Perform quality control to exclude images with aberrations or where image analysis failed
  • Perform a reproducible data analysis
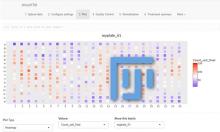
  • Normalize data and report statistical significance

Image visualization relies on Fiji/ImageJ, along with its wealth of analytical tools.

shinyHTM can be used to analyze image features obtained with CellProfiler, ImageJ or any other bioimage analysis software. The output of analysis is a publication-ready scoring of the data.

shinyHTM is based on the R shiny package.

shinyHTM