Visualisation

Re-occurs among biii.info tags (visualisation, rendering, viewer, classification, ...)

Synonyms
Plotting
Description

Dragonfly is a software platform for the intuitive inspection of multi-scale multi-modality image data. Its user-friendly experience translates into powerful quantitative findings with high-impact visuals, driven by nuanced easy-to-learn controls.

For segmentation: It provides an engine fior machine Learning, Watershed and superpixel methods, support histological data .

It offers a 3D viewer, and python scripting capacities .

It is free for reserach use, but not for commercial usage.

DragonFly
Description

Web based viewer developped for google for very big data: 

Neuroglancer is a WebGL-based viewer for volumetric data. It is capable of displaying arbitrary (non axis-aligned) cross-sectional views of volumetric data, as well as 3-D meshes and line-segment based models (skeletons). The segmentation has to be done before loading the dataset, it is not done Inside the viewer.

This is not an official Google product.

It has among other the nice feature of beeing able to generate url for sharing a specific view.

Note that the only supported browser for now are 

  • Chrome >= 51
  • Firefox >= 46


Neuroglancer
Description

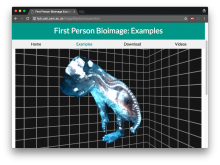
FPBioimage is a volumetric visualization tool which runs in all modern web browsers. Try the tool yourself at our example site here.

has function
Description

The PYthon Microscopy Environment is an open-source package providing image acquisition and data analysis functionality for a number of microscopy applications, but with a particular emphasis on single molecule localisation microscopy (PALM/STORM/PAINT etc ...). The package is multi platform, running on Windows, Linux, and OSX.

It comes with 3 main modules:

  • PYMEAcquire - Instrument control and simulation
  • dh5view - Image Data Analysis and Viewing
  • VisGUI - Visualising Localization Data Sets

Visualization of 3D images with Matlab

Submitted by Perrine on Mon, 04/08/2019 - 13:58

In this session we will use a 3D multichannel reconstruction of zebrafish larva to explore the visualization capabilities of Matlab. We will start from extracting and inspecting single slices and will continue with combining multiple channels, finally generating a surface rendering for visual colocalization analysis.During the process we will review methods for manipulating multidimensional arrays, including resizing, reshaping and conditional selection.