gene loci

Description

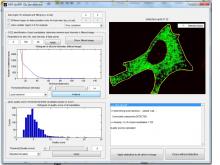
Matlab toolbox to analyze single molecule mRNA FISH data. Allows counting the number of mature and nascent transcripts in 3D images. See 2513. Following toolboxes are required: - Optimization toolbox - Statistics toolbox - Image processing toolbox - (Optional) Parallel processing toolbox


Input data type: 3D image

Output data type: CSV

has function
Description

Quote:

Fluorescence in situ hybridization (FISH) is used to study the organization and the positioning of specific DNA sequences within the cell nucleus. Analyzing the data from FISH images is a tedious process that invokes an element of subjectivity. Automated FISH image analysis offers savings in time as well as gaining the benefit of objective data analysis. While several FISH image analysis software tools have been developed, they often use a threshold-based segmentation algorithm for nucleus extraction. As fluorescence signal intensities can vary significantly from experiment to experiment, from cell to cell, and within a cell, threshold based segmentation is inflexible and often insufficient for automatic image analysis, leading to additional manual extraction and potential subjective bias. To overcome these problems, we developed a graphical software tool called FISH Finder to automatically analyze FISH images that vary significantly. By posing the nucleus extraction as a classification problem, compound Bayesian Classifier is employed so that contextual information is utilized, resulting in reliable classification and boundary extraction. This makes it possible to analyze FISH images efficiently and objectively without adjustment of input parameters.

has function