Microscopy

Synonyms
Slide scanner
Description

An R package for the (3D) visualisation and analysis of biological image data, especially tracings of single neurons. nat is the core package of a wider suite of neuroanatomy tools introduced at http://jefferislab.github.io.

has function
Description

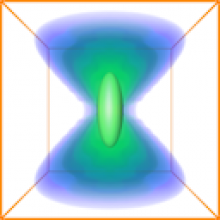
ClearVolume is a real-time live 3D visualization library designed for high-end volumetric microscopes such as SPIM and DLSM microscopes. With ClearVolume you can see live on your screen the stacks acquired by your microscope instead of waiting for offline post-processing to give you an intuitive and comprehensive view on your data. The biologists can immediately decide whether a sample is worth imaging. ClearVolume can easily be integrated into existing Java, C/C++, Python, or LabVIEW based microscope software. It has a dedicated interface to MicroManager/OpenSpim/OpenSpin control software. ClearVolume supports multi-channels, live 3D data streaming from remote microscopes, and uses a multi-pass Fibonacci rendering algorithm that can handle large volumes. Moreover, ClearVolume is integrated into the Fiji/ImageJ2/KNIME ecosystem. You can now open your stacks with ClearVolume from within these popular frameworks for offline viewing.

has function
Description

Software for analysis, visualization, simulation, and acquisition  of data from spectroscopy and fluorescence microscopy.

  • Fluorescence Correlation Spectroscopy (FCS)
  • Fluorescence Lifetime Imaging (FLIM) and Phasor plots
  • Förster Resonance Energy Transfer (FRET)
  • Generalized Polarization (GP) and Spectral Phasors
  • Number and Brightness (N&B)
  • Photon Counting Histogram (PCH)
  • Raster and Spatio-temporal Image Correlation Spectroscopy (RICS and STICS)
  • Single Particle and Modulation Tracking (SPT, MT)
  • Image Mean Square Displacement (iMSD)
  • Pair correlation function (pCF)
has function
Description

An object detection function in ImageJ. [Analyze > Analyze Particles...]. It could simply be used for counting number of cells, but could also do more complex stuffs. ## Jython Snippet Here is a snippet of how to use Particle Analysis in Jython script.

has topic
need a thumbnail
Description


In this workflow, you can use MorphoLibJ to generate accurate morphometric measurements

  • First the fibers are segmented by mathematical morphology:
    • for example by using MorphoLibJ:
      • Create a marker image by creating a rough mask with extended regional maxima (similar to Find Max), such that you have one max per fiber
      • Use the marker controlled watershed (in MorpholLibJ/ Segmentation/ marker controlled watershed) : indicate the original grayscale image as the input, Marker will be your maxima image, select None for mask
      • it will create a label mask of your fibers
  •  In MorphoLibJ /analyze/ select Region Morphometry: this will compute different shape factors which are more robust than the ones implemented by default in ImageJ
  • Export the result table created to a csv file
  • Then for example in Matlab or R, you can apply a PCA analysis (Principal component analysis) followed by a k-means with the number of class (clusters) (different fibers type) you want to separate.
  • You can then add this class as a new feature to your csv file.
  • From this you can sort your labelled fibers into these clusters for a visual feedback or further spatial analysis
has topic
hemp analysis