Object classification

Synonyms
Semantic object classification
Isolated object classification
Description

QuantCenter is the framework for 3DHISTECH image analysis applications. with the goal of helping the pathologists to diagnose in an easier way. QuantCenter, is optimized for whole slide quantification. It has a linkable algorithm concept that tries to provide an easy-to-use and logical workflow. The user has different quantification modules that he or she could link one after other to fine-tune or to speed up the analysis.

QuantCenter logo
Description

This module is for learning classification models from ground-truth data (supervised learning). It downloads from Cytomine-Core annotation images and coordinate of annotated objects from project(s) and build a annotation classification model which is saved locally.  

It is used by Cytomine DataMining applications: classification_validation, classification_model_builder, classification_prediction, segmentation_model_builder and segmentation_prediction. But it can be run without Cytomine on local data (using dir_ls and dir_ts arguments).

has topic
need a thumbnail
Description


In this workflow, you can use MorphoLibJ to generate accurate morphometric measurements

  • First the fibers are segmented by mathematical morphology:
    • for example by using MorphoLibJ:
      • Create a marker image by creating a rough mask with extended regional maxima (similar to Find Max), such that you have one max per fiber
      • Use the marker controlled watershed (in MorpholLibJ/ Segmentation/ marker controlled watershed) : indicate the original grayscale image as the input, Marker will be your maxima image, select None for mask
      • it will create a label mask of your fibers
  •  In MorphoLibJ /analyze/ select Region Morphometry: this will compute different shape factors which are more robust than the ones implemented by default in ImageJ
  • Export the result table created to a csv file
  • Then for example in Matlab or R, you can apply a PCA analysis (Principal component analysis) followed by a k-means with the number of class (clusters) (different fibers type) you want to separate.
  • You can then add this class as a new feature to your csv file.
  • From this you can sort your labelled fibers into these clusters for a visual feedback or further spatial analysis
has topic
hemp analysis
Description

Quantification of HER2 immunohistochemistry.

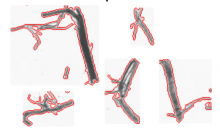
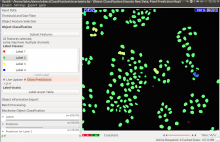
ImmunoMembrane is an ImageJ plugin for assessing HER2 immunohistochemistry, described in [bib]2472[/bib]. It is important to read the URL documentation and original paper to understand how to use the plugin appropriately.

There is web service available. Users can upload image data to process them and get cell membrane to be segmented: Web ImmunoMembrane

Note also that the pixel size is not read automatically from the image, but rather the source image scale should be entered into the dialog box - and the image rescaled accordingly prior to analysis. This scale value is the inverse of the value normally found for pixel width and pixel height under Image -> Properties... (i.e. pixel width & height are given in microns per pixel; the dialog box asks for pixels per micron).

has topic
Description

This workflow classifies objects based on object-level features (e.g. intensity based, morphology based, etc) and user annotations. It needs segmentation images besides the raw image data. Segmentation images can be obtained from ilastik pixel classification, or binary segmentation images from other tools. Within the object classification, one can prefilter objects through thresholds (on pixel probability image) or object sizes (on segmentation image). Outputs are predicted classification label images. Selected features can also be exported. Advanced users also have possibilities to add customized (object) features for classification in a simple plugin fashion through python scripts.